Keepers going short, refs walking tall – Analysis Tuesday, 1st Apr 2025 18:45 by Andrew Scherer (@scheza) In his latest data analytics piece our resident number cruncher Andrew Scherer examines the Championship’s growing fascination with ‘play out from the back’ and where QPR fit within it, while also going searching for bias in the division’s refereeing fraternity. To date I have written four data pieces for Loft for Words. Three have come at varying stages of mid-season panic and one – 23/24 round up – sailed in with a sense of triumphalism as we beat the odds (and my prediction) to stay up. When I started compiling this piece, such levels of jeopardy or excitement were (pleasantly) absent. Obviously, the team’s form cratering in a sadly all-too-typical QPR manner does leave a few more question marks hanging over the remainder of the season than we would like but rather than pore over our strong winter and faltering spring, which can hopefully wait until we’ve made it back from Sunderland in May, I thought I would take the opportunity to look at some broader trends in the Championship in recent years: passing styles, playing out from the back, and also some statistics on referees. Health warning: features Andy Woolmer and Keith Stroud. Championship trendsWith the rise of Guardiola-lite managers (hello, Russell Martin) and a general increased willingness from teams to try and retain possession, the Championship feels like a league that has shifted stylistically in recent years. Is this more perception than reality? And what does it mean in terms of outcomes – are we seeing more goals or is it a case of bored to death by a thousand passes? Let’s have a look. If we start at the back, there is absolutely no doubt that long balls from goalkeepers are in marked decline. In 2018/2019, each goalkeeper would attempt long passes (i.e. 40 yards or more) a little over 39 times per Championship game. This season that figure is 24.7 – over a third less. Teams are, quite simply, attempting to play out from the keeper a lot more. 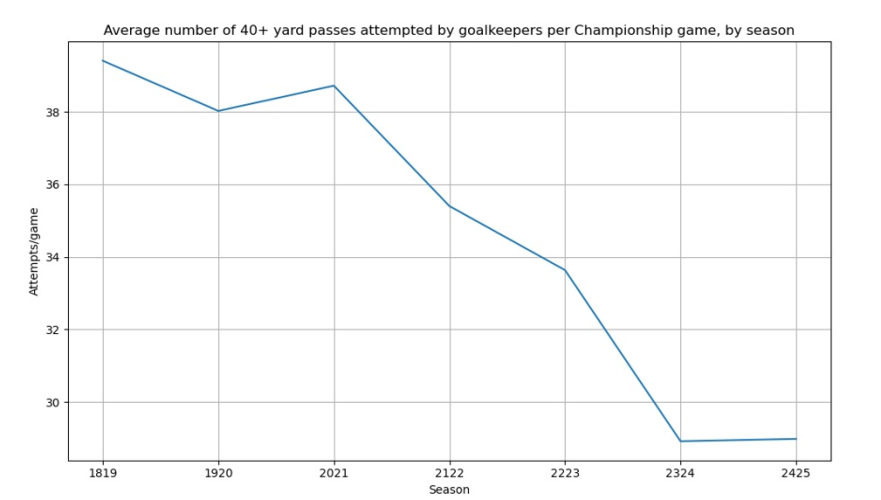 There is a (somewhat) corresponding change in the proportion of touches teams take within their defensive third. In 2018/19 this was a little over 42.5%, this season it is a little over 45.6% That is only a small increase however – which suggests while goalkeepers are playing the ball shorter more frequently, this doesn’t necessarily mean the ball hangs around at the back for that much longer. 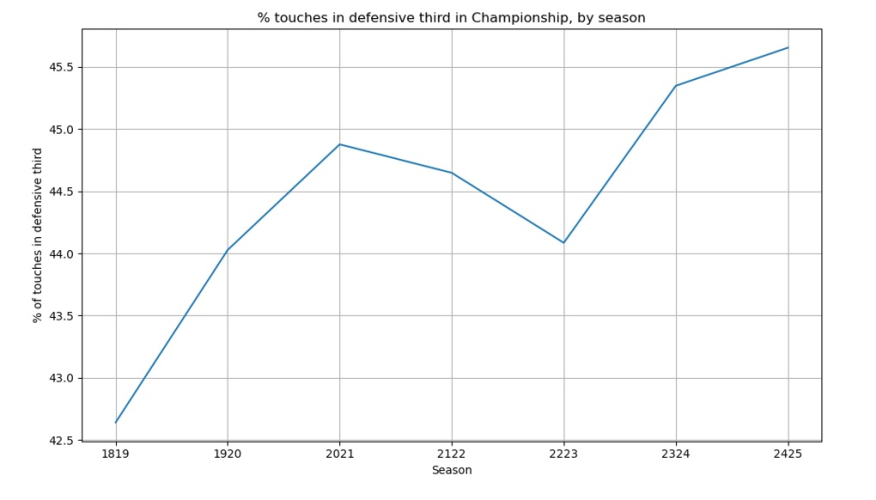 This is interesting and prompts the question: what are teams aiming to achieve when they go short from the goalkeeper? In principle, I would guess something along the lines of retain possession, invite any press, and attempt to spring it quickly (or, if that fails, resort to a longer ball forward) – hence the discrepancy between rate of increase in short passes from the keeper and touches in the defensive third. When this works, great. But there’s also a small negative correlation between long balls from the keeper and defensive errors – i.e. teams who are more direct from the keeper do make fewer mistakes at the back. We will come onto what these stats look like for QPR specifically shortly. What about passing overall? As you would expect, there has been a small decline in the proportion of long balls played (from over 20% in 18/19 to under 16% in this season and last) but short passes have remained relatively constant. It is instead medium passing that has increased as a proportion of overall pass attempts. These are relatively small changes, though, and while they demonstrate a certain level of stylistic shift, I am not sure they are evidence of a wholesale tactical revolution in the second tier. There is, in other words, still plenty of stodge to feast on. 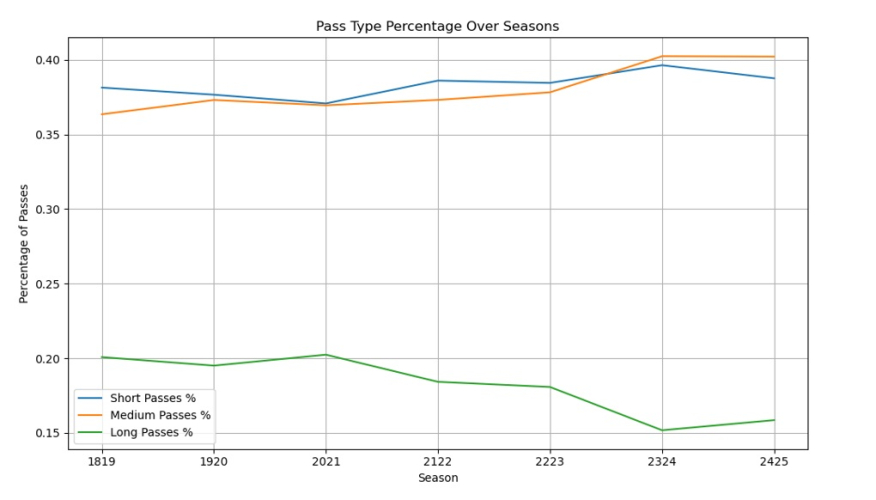 I could at this stage give you a graph showing a link between short passing and goals and we could all hail Russell Martin as the puritanical tactical genius of our age. That would, however, be confusing correlation with causation. Teams who pass short more do tend to score more – but that is because they have better players, not because short passing inherently leads to more goals. Which harks back to the point raised in the previous paragraph: there is a balance to be found between playing out and going long, between keeping possession and launching channel balls. If you have the players, great! Tiki taka all the way home. But if a chunk of your side are less confident with the ball at their feet there is a horses-for-courses decision to be taken about the best approach to scoring more (and conceding fewer). Which brings us onto QPR. Let’s compare the Rs’ numbers with the league average, first off for long balls from the keeper. 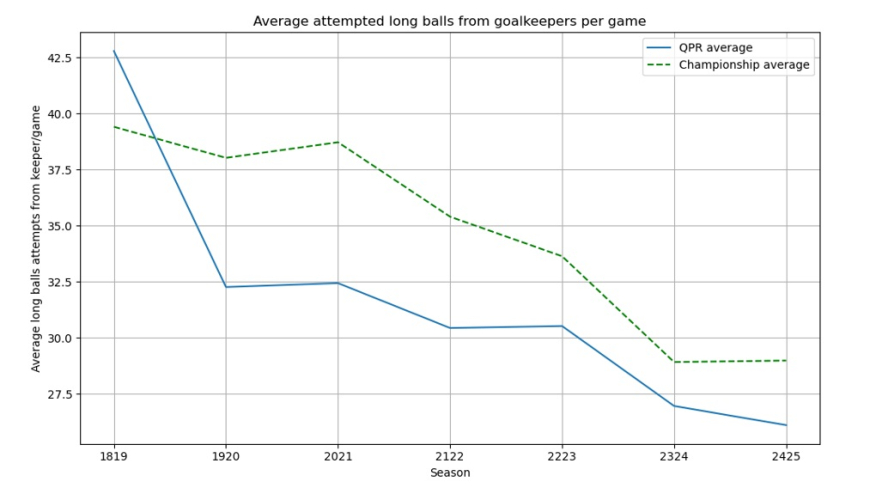 As you can see, we have tracked the league trend pretty closely while remaining somewhat below average – i.e. playing slightly fewer long balls from the keeper than is typical for the Championship. Where things become a little more revealing is how we compare to the league in terms of proportion of touches in our own defensive third. If you harbour suspicions that, when we play out from the back, we often struggle to progress the ball effectively then this next graph is for you. 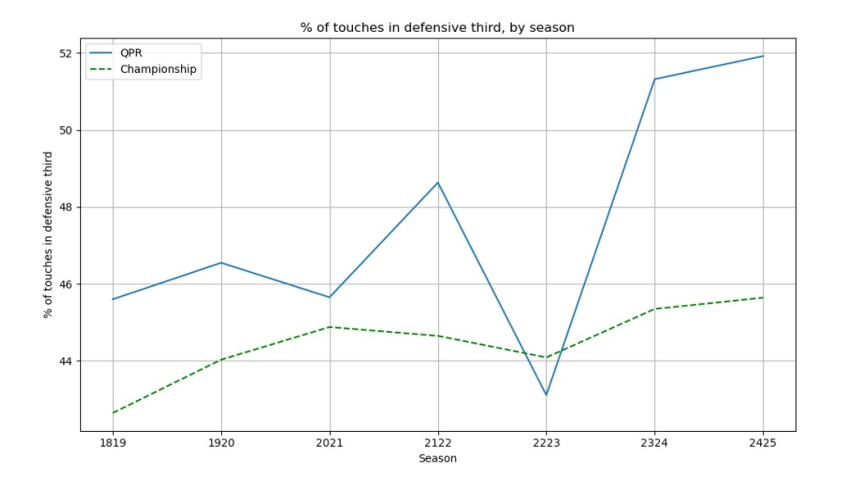 As we saw earlier, the league-wide decrease in long passing from goalkeepers has led to a small rise in the proportion of touches teams take in their own third. But for QPR, that increase is a lot more pronounced. In other words, there appears to be a pattern whereby when we play out from the keeper we are more likely than average to end up with possession at the back than further forward. We can speculate whether that is personnel, opposition effectiveness, tactics or anything else. But it is a data point that is worth keeping an eye on. One positive should be noted, however: under Cifuentes we do seem to be conceding fewer chances from our own defensive mistakes. 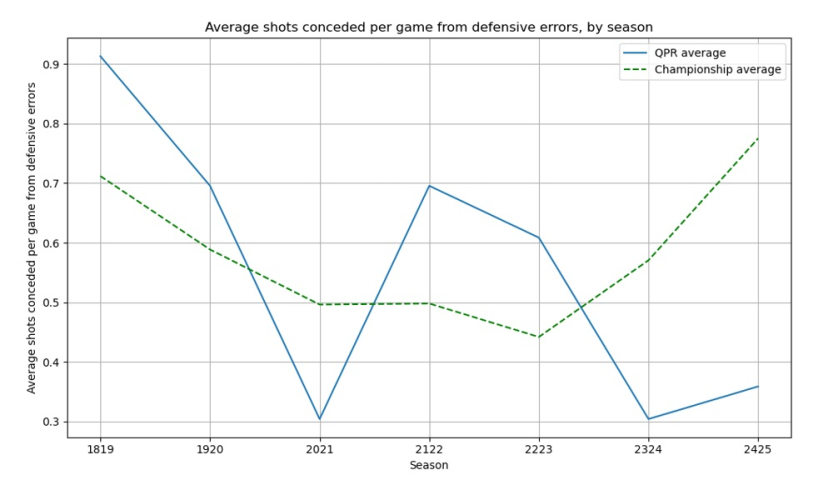 ‘Defensive mistakes’ do not, of course, solely encompass giving the ball away at the back, but it is encouraging that while we are not necessarily progressing the ball as effectively as we might like, we also seem to be minimising risks in possession (not that it always feels like it when Paul Nardi slowly rolls the ball to Steve Cook for the seventh time on the trot as the opposition press closes in…). Of course you might argue that taking more risks might help with better progression out of our own third but it is a fine balance and, given the make-up of the team in recent years, I do not blame Cifuentes for erring on the side of caution. And what about percentage of short passes? Again, we have roughly tracked league trends but in the last two years have been a little more inclined to go long than the rest of the Championship. 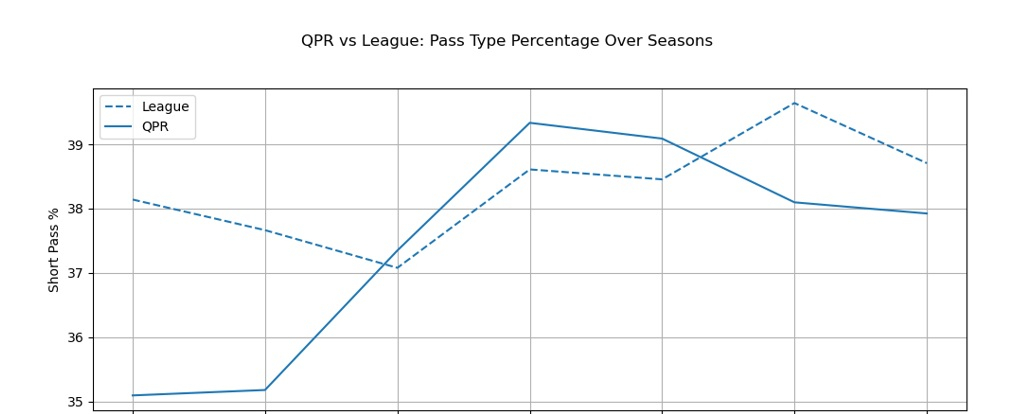  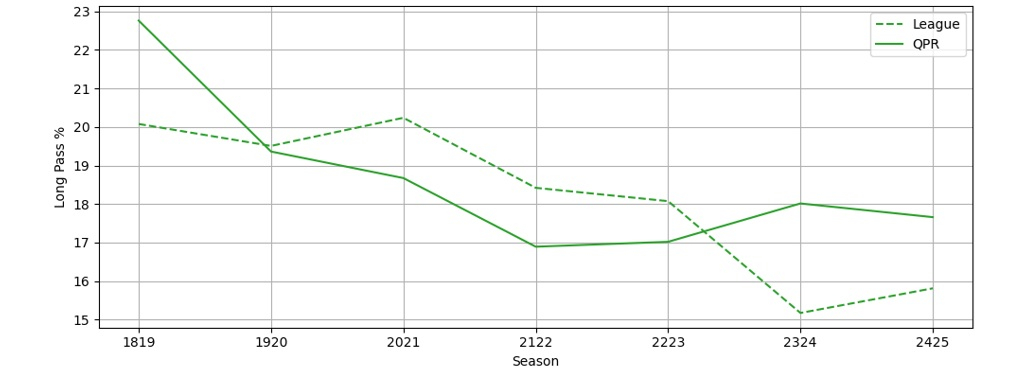 Clearly Queens Park Rangers as a club have gone through a range of managers and styles that can at best be described as ‘erratic’ in the period we are looking at so I am not sure there are any firm conclusions you can draw from our data. That said, I find it interesting that we have tracked league trends relatively closely, even as we have cycled through managers as different as Mark Warburton, Mick Beale, Gareth Ainsworth, and Marti Cifuentes. So rather than finishing this section with a conclusion, I’ll end it with a question. If we are mirroring the league styles closely, with a squad that costs less than most of our opponents, is there a natural ceiling on where we can end up? Whistleblower dataFor the second half of this piece, I wanted to spend some time looking at data on referees. This was prompted by a conversation in the (delightful) Old Joint Stock pub in Birmingham ahead of our defeat at West Brom as we reflected on officials’ performances in recent games which smacked of wanting an easy ride in front of a vocal home crowd (notably at Millwall and Portsmouth). Before we get into the meat of the data, I do want to throw up a pre-emptive proviso (starting sections with provisos always makes for compelling reading). Referees have a pretty thankless task, one they try to do to the best of their ability. I have a great deal of sympathy with (many of) them and I think their elevation to a quasi-celebrity status, driven by 24-hour news and online crusades but not addressed by the PGMOL, is not a good thing for the game. I have, therefore, thought carefully about how to frame any analysis of refereeing performance so as not to stir conspiracy theories. And, as we shall see, I think the data paints a broadly positive picture of officials’ neutrality (even if the decision making itself can be somewhat erratic). But potential for misinterpretation is not an argument for leaving this sort of thing alone: it is important to examine performance in the open. A failure to engage with this is what stokes fans’ frustrations and sense of injustice and, for me, one of the big failures of the PGMOL – instinctively closing ranks is not an effective long-term strategy for defending and supporting your members. With that out the way, let’s look at some numbers… General Championship data We’ll start with some general statistics from the last ten Championship seasons to get a sense of what normal looks like (insofar as Championship refereeing is ‘normal’). On average there are just short of 23 fouls and 3.4 yellow cards per game, and only 0.13 reds (useful benchmarks to bear in mind when trying to assess if a game is niggly or not being allowed to flow). 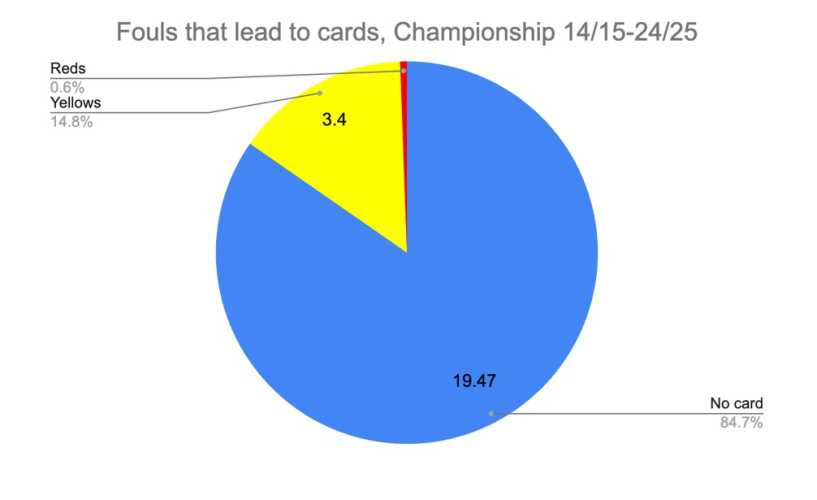 Obviously within this there is variation between individual referees but it’s not wildly different. Of the 43 officials who have taken charge of at least 25 Championship games in the last decade, Robert Jones averages the most fouls per game (26.26) while Samuel Barrott the least (20.62). Both are now predominantly in the Premier League and are on the FIFA list (which, as a side note, runs counter to my presumption that only disciplinarians are promoted). Leigh Doughty has the highest yellows per game (4.13) while Michael Salisbury has the lowest (2.84). For a slightly different measure of how strict a referee is we can also look at fouls per yellow card. Across all games, just under 15% of fouls result in a yellow. The strictest ref by this measure is Anthony Backhouse at 19.44% while (interestingly) our old friend Andy Woolmer and Tony Harrington are the most lenient at 12.6%. Perhaps a nod to the fact that leniency is not always a good thing and can tip over into lack of control. 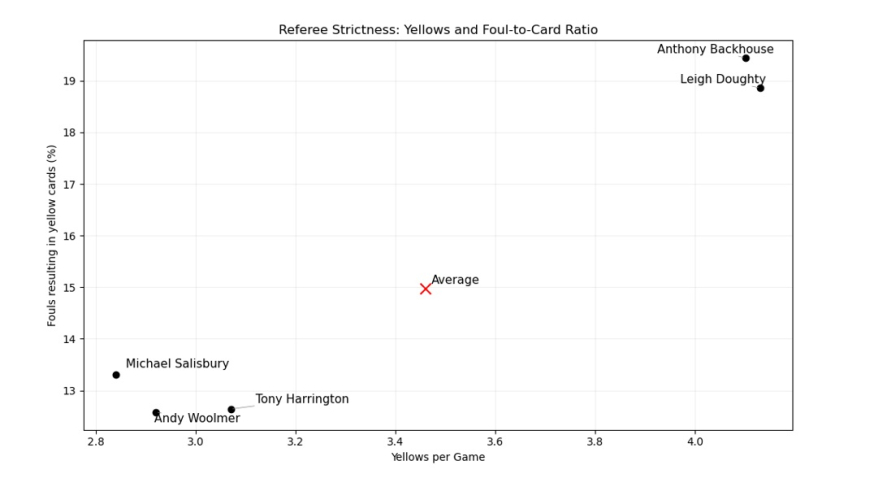 Refs: home v away Returning to the initial question that prompted this mini exploration: are some refs, as Nick London cheekily likes to put it, truly a “Bart’s Dad”? The theory makes sense in principle: no matter how determined you are to be neutral, it is very hard to remain completely unswayed by tens of thousands of people shouting at you – whether that is for a penalty or questioning your private leisure pursuits. But a theory making sense doesn’t automatically make it true. So to try and prove our hypothesis, I have looked at each referee’s record to see: Let’s start by plotting all the 43 referees on a chart showing the average difference in home and away over-/under-performance for each official, against the proportion of fouls where they give bookings for home versus away teams. 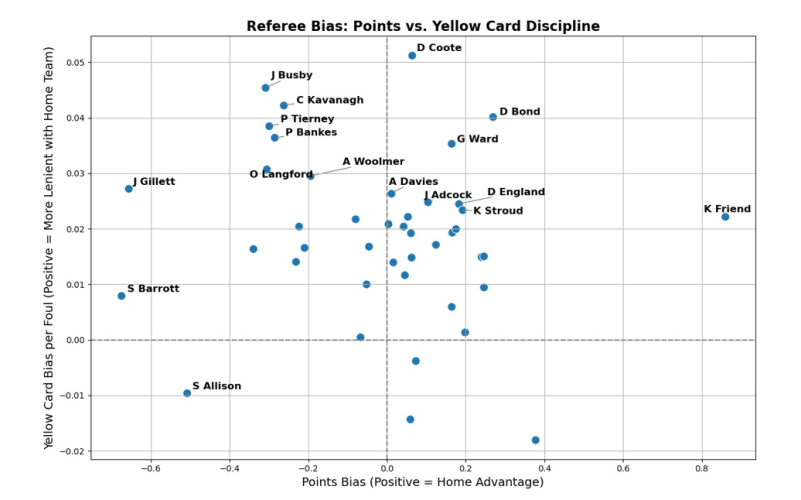 I have labelled the biggest outliers and there are, of course, some familiar names there. But there’s nothing particularly wild in what we’re seeing. Home teams do get fewer bookings per foul but this is expected: they’re typically the ones doing more of the attacking and therefore less likely to be committing cynical offences or preventing good opportunities. And the relatively even distribution of referees between home and away points advantage is impressive: certainly no league-wide bias at play here. If we dig into individuals, on the face of it Kevin Friend looks like an interesting outlier in terms of sheer points bias for home teams – but his data is only across 27 matches which is way too few to draw any firm statistical conclusions. The now former referee David Coote was seemingly much harsher on away teams than home teams when it came to yellows per foul…but there was practically no discernible points advantage as a result. And that’s kind of the point here. When attempting to assess referee bias using pure data alone you end up heading down something of a dead end. If we thought referees who were harsher on the away team were having an impact on match results, we would expect this to show up in the data. But looking at the relationship between referee harshness on away teams and additional home points gained above recent form, there just isn’t any causative link (for those wondering: the statistical test applied here, regression analysis, produced a p-value of 0.411 – where the p-value is a score between 0 and 1 and typically we expect it to be 0.05 or below if there is any real relationship between the two). That is not to deny the existence of referees who favour home teams - they may walk (and whistle) among us - but they don’t reliably show up in the data. Sure, some referees may have games where they seem infuriatingly obsequious to the locals – but they invariably balance it out with other games where the away team gets the rub of the green. Which brings me nicely full circle around to a point I raised at the start of this section. I am but a strategically shaved monkey with a computer and some numbers plucked off the internet. I did really want to find some smoking gun evidence of systemic failings among referees. I was unable to. From what I can see, such failings do not exist. Some officials are fundamentally just a bit crap, sure, but they are honest in the application of their crapness. The FA, the Football League, and the PGMOL have access to a wealth of data, both qualitative and quantitative, with which they can do far better assessments of the people who ensure our sport can take place – data which they keep a closely guarded secret. I get that it can be sensitive, particularly in a world of online hate campaigns and depressingly frequent death threats. But we have online hate campaigns and depressingly frequent death threats right now. Surely it has to be worth trying even a slightly more open approach? An approach where you don’t treat all football fans like idiots in the name of ‘protecting’ referees and leave a vacuum for nonsense rumours and conspiracy theories to spread? So, I will finish this piece with a plea to the relevant authorities. Give us some broad brushstroke data. Give us a general indication of your assessments. Let us see who you think is doing well. Help us empathise by knowing you recognise when a ref has had some bad days at the office. Better yet, why not try some crowd-sourced assessments? They need not carry much weight but it would give you a sense of where the football public is a little out-of-step with the football administrators. I have spent half a day looking at basic numbers and it’s done a lot more for my confidence in refereeing than any number of pronouncements from the PGMOL ever have. Imagine if fans had access to more of this. Let’s draw a foam line on the grass and start afresh. After all, now Keith Stroud has retired, what have you got to hide? More from this author >>> Destroyer of optimists >>> Light at the end of the tunnel? >>> A season in three thirds >>> Has the Marti Express been derailed? If you enjoy LoftforWords, please consider supporting the site through a subscription to our Patreon or tip us via our PayPal account loftforwords@yahoo.co.uk. Pictures - Ian Randall Photography Please report offensive, libellous or inappropriate posts by using the links provided.
You need to login in order to post your comments |
Queens Park Rangers Polls[ Vote here ] |
We in turn value your personal details in accordance with our Privacy Policy.
